What are dietary reference values (DRVs) used for in nutrition?
Last Updated : 16 December 2025Key takeaways:
- Dietary Reference Values (DRVs) are a set of reference values for nutrient intake which indicate the amount of an individual nutrient that people need for good health, depending on their age and gender.
- DRVs are used for dietary assessment, planning diets, and developing dietary recommendations for individuals or groups, and for food labelling.
- DRVs aren’t personal diet goals but reference points that help compare foods and spot nutrient gaps.
- By reading nutrition labels and following food-based guidelines, you can use DRVs to eat smarter and support your long-term health.
We all need the right balance of nutrients to stay healthy, but how do expert know how much is enough? That’s where Dietary Reference Values (DRVs) come in. DRVs are scientific benchmarks that help guide food policies, nutrition labels, and dietary advice across Europe. Whether you’re choosing a snack or planning meals for your family, understanding DRVs can help you make better food choices. This article explains what DRVs are, the different types, and how they’re used in everyday life.
What are Dietary Reference Values (DRVs)?
Dietary Reference Values (DRVs) are science-based estimates of how much energy and nutrients we need to support and maintain optimal health, prevent nutrient deficiencies, and lower the risk of chronic diseases. DRVs aren’t specific recommendations to follow for individuals, but they’re rather used at the population level. They’re used by healthcare professionals and policy makers to help guide, for example, national dietary guidelines, school feeding programmes, nutrition labels, and dietary assessment tools.1
The European Food Safety Authority (EFSA) develops DRVs to show how much of each nutrient we need for good health. These values cover:
- Macronutrients & water: protein, fat, carbs (including fibre), and water
- Micronutrients: vitamins (A, D, E, K, C and the B-vitamins), plus minerals like calcium, iron, iodine, zinc, magnesium, selenium, and potassium
- Energy: Based on your basal metabolic rate (BMR) adjusted for how active you are (PAL ).
Because nutrition science is always evolving, DRVs are regularly reviewed. For instance, the safe upper limit for vitamin E was under review in 2024. EFSA’s website posts updates whenever new evidence emerges.1
What Types of Nutrient Reference Values Are There?
DRVs help you understand whether you’re getting enough of each nutrient – or possibly too much. There isn’t just one DRV. Different types serve different purposes.1-4 These include:
|
Type |
What it means |
Usage |
|
Average Requirement (AR) |
The amount of a nutrient that meets the needs of 50% of healthy people in a specific age and sex group. |
Used for assessing nutrient adequacy and planning for populations. If your intake is below this, you may not be getting enough. |
|
Population Reference Intake (PRI) |
The amount of a nutrient that meets the needs of almost everyone (97.5%) in a group (approximately two standard deviations above the AR). |
Serves as the recommended intake target for most people. |
|
Lower Threshold Intake (LTI) |
Intake below this level likely means deficiency. |
Indicates a high probability of inadequacy; used to flag very low intakes. |
|
Adequate Intake (AI) |
Set when there is insufficient data to establish an AR or PRI; based on healthy population averages. |
Used when other values aren’t available; not suitable for estimating the prevalence of inadequate intakes. |
|
Tolerable Upper Intake Level (UL) |
The maximum daily nutrient intake that is unlikely to cause adverse health effects in the general population when consumed over the long term. |
Used to assess the risk of overconsumption and guide safe supplement use. Avoid going above this to reduce risk of harm. |
|
Reference Intake (RI) |
Guidelines for energy (kcal) and macronutrients (carbohydrates, protein, fats); defined as a percentage range of total daily energy intake. |
Supports balanced macronutrient distribution; often used in food labelling. These can be used to help you compare food products. |
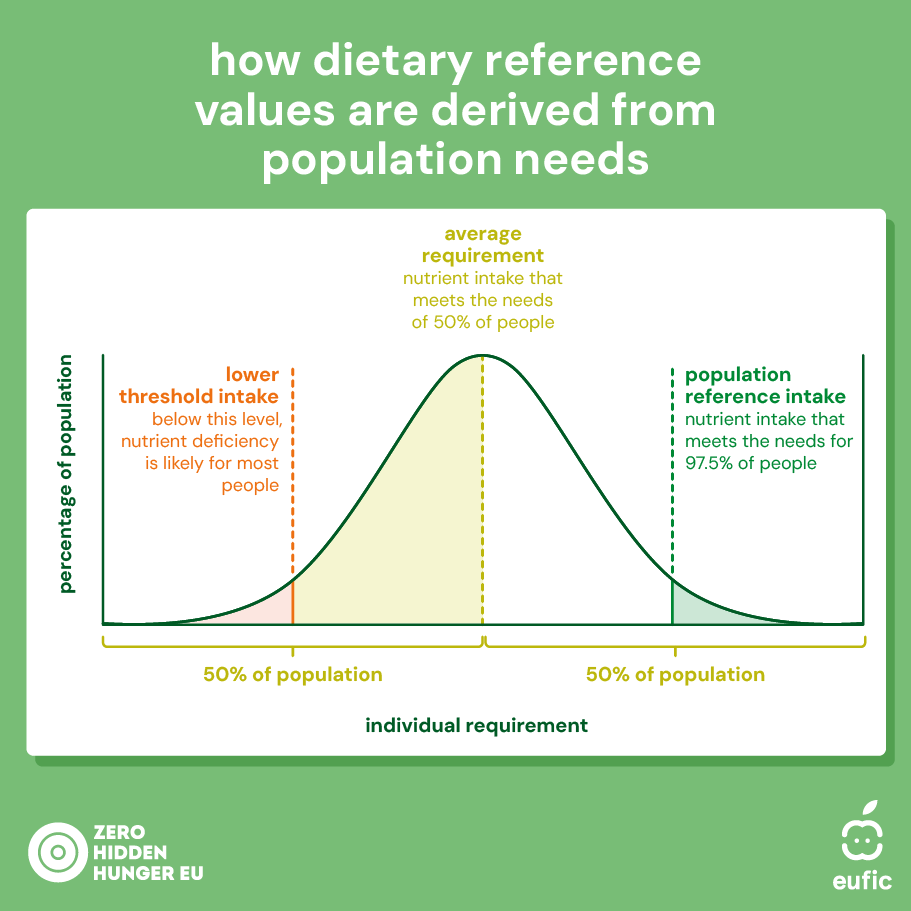
Fig. 1 – Dietary reference values and what they mean.
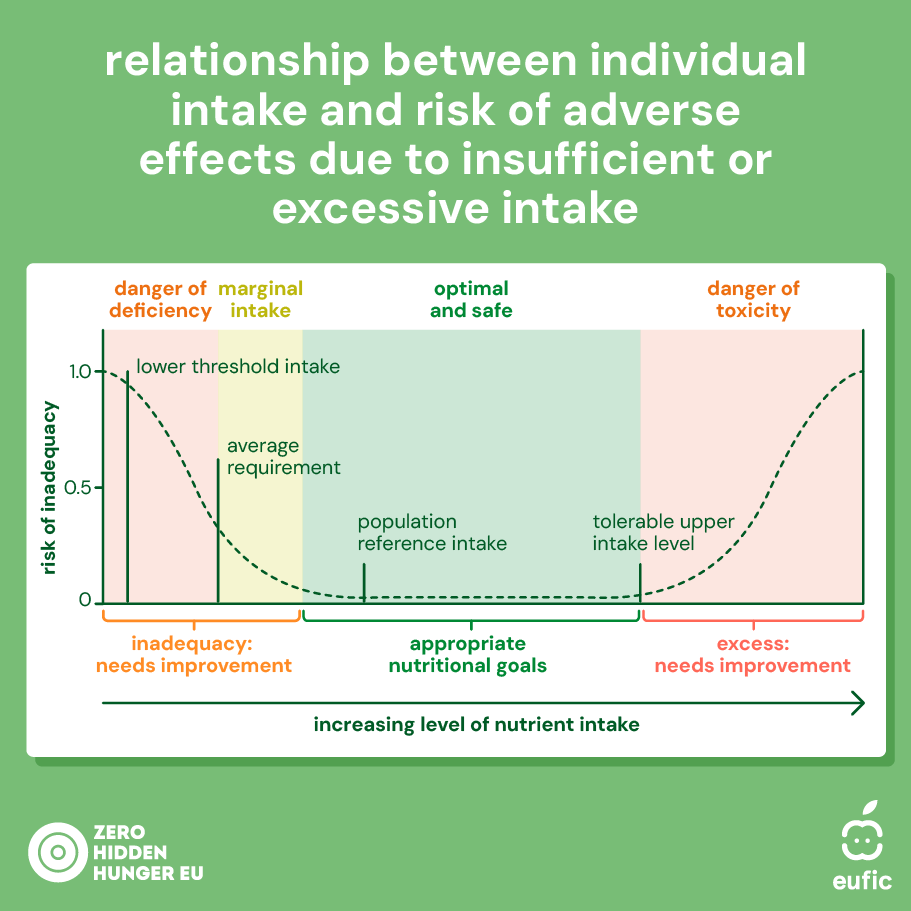
Fig. 2 - Relationship between nutrient intake and risk of adverse health effects.
Who are dietary reference values for: children, adults or both?
DRVs are designed for healthy people of all ages: infants (7-11 months), children & adolescents (1-17 years), adults (>18 years) and pregnant or lactating people.
Nutrient needs vary considerably depending on age, sex, physiological condition, and activity level. EFSA creates guidelines for different ages and life stages so that everyone – from babies to older adults – gets advice that fits their unique needs. This helps make sure that the food and nutrient recommendations work well for each group.1,2,3,5 For infants under 6 months of age, EFSA does not set DRVs because nutritional needs during this period are generally assumed to be fully met by breast milk or infant formula. Instead, national public health authorities may issue specific guidance based on local infant feeding policies and health priorities, for example recommendations for vitamin D supplementation which are widespread in the EU. From the age of 7 months onwards, DRVs are established to guide the introduction of solid foods and support healthy growth and development in early life.1,3,5,6
How are dietary reference values used?
Dietary Assessment and Planning
DRVs act as reference points for comparing what people eat with what they need.
For individuals:
- Intake lower than AR: likely inadequate
- Intake lower than LTI: high risk of deficiency
- Intake higher than UL: potential for adverse effects
- Intake more than or equal to AI (when PRI is not available): likely adequate, though uncertainty remains.
For groups:
- If the average intake is close to the PRI: low chance of deficiency
- If the average intake drops to the LTI or lower: many people may be at risk
Dietary Goals and Recommendations
DRVs are the backbone of food-based dietary guidelines (FBDGs). These translate the numbers into everyday advice, like:
- Keep saturated fat < 10% of total energy (total calories)
- Aim for at least 25 g of fibre a day
EFSA also supports European countries in adapting these guidelines to their local food culture.
Food Labelling
You’ve probably seen DRVs in action on product nutrition labels.7 The reference intakes (RIs) printed on packs are based on an average 2000 kcal (8400 kJ) diet:
- 70 g fat (20 g saturated)
- 260 g carbs (90 g sugars)
- 50 g protein
- 6 g salt
So, a yoghurt label showing 2.6 g fat per 100 g = 4% RI means that portion contributes 4% of the daily reference value for fat. Vitamins and minerals can also be listed if one portion provides at least 15% of the daily value.
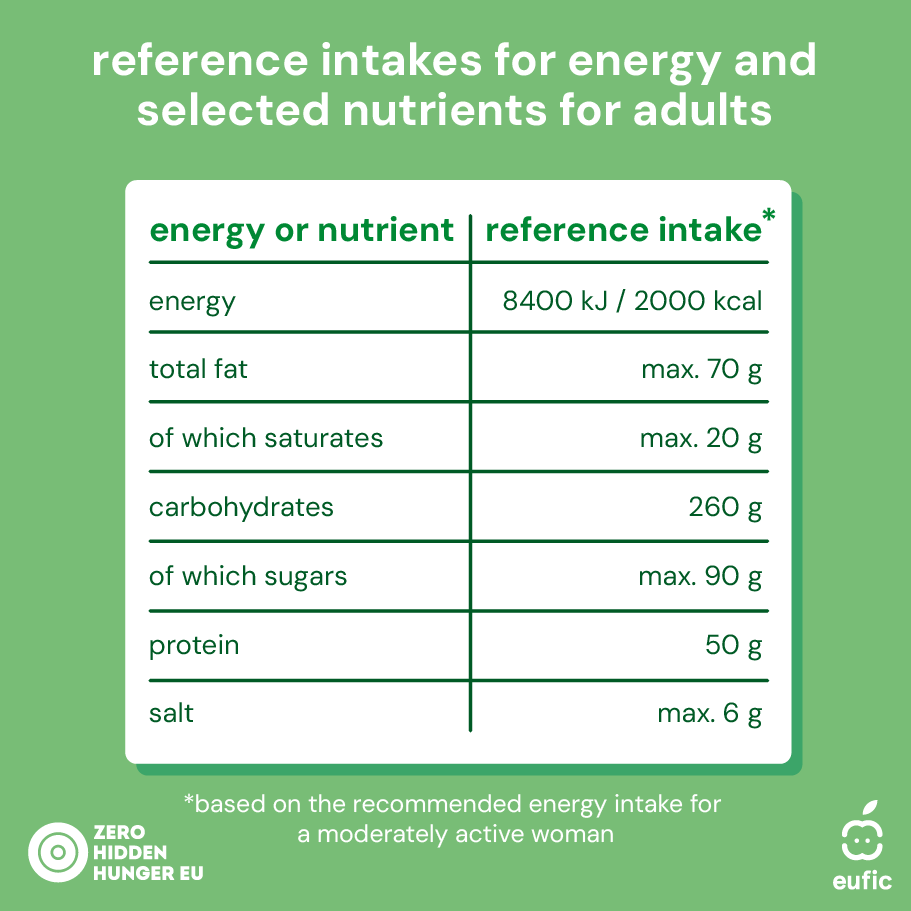
Fig. 3 – Dietary reference intakes for energy and some nutrients.
These values are there to help you compare foods at a glance, not to set personal diet goals. Nutrition labels usually show the % RI per portion or per 100 g/mL. Vitamins and minerals can be listed too, as long as one portion provides at least 15% of the daily value (NRV).
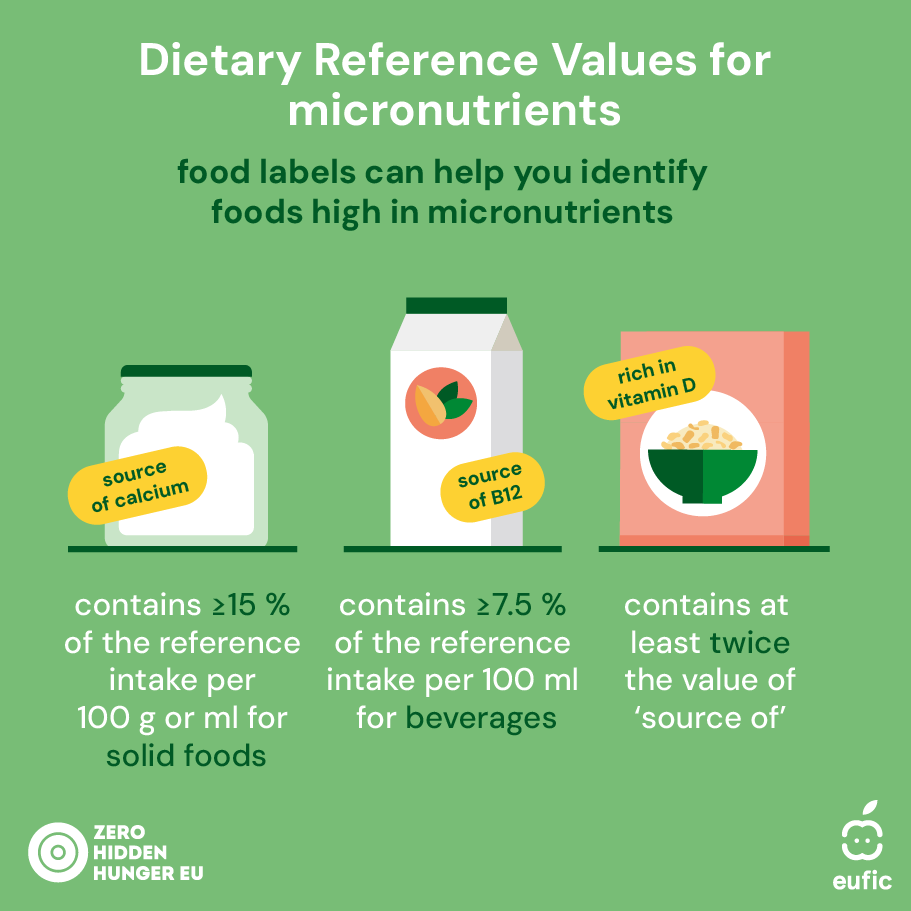
Fig. 4 – How food labels can help you identify foods high in micronutrients.
Conclusion
Dietary Reference Values (DRVs) are at the heart of nutrition policy and practice in Europe. They take the science of what our bodies need and turn it into clear guidance that shapes food labels, dietary advice, and public health goals. From helping health professionals plan diets to making nutrition labels easier to understand, DRVs influence the way we all eat. And because the science never stands still, EFSA keeps updating these values so they reflect the latest evidence. In short: DRVs are the hidden framework behind the nutrition advice we see every day and they’ll keep evolving as our knowledge grows.
Further Information
The EFSA DRV Finder is an interactive tool that gives quick and easy access to EFSA’s Dietary reference values (DRVs) for nutrients.
This article was produced in collaboration with Zero Hidden Hunger EU. Zero Hidden Hunger EU has received funding from the European Union’s Horizon 2020 Research and Innovation programme under Grant Agreement No. 101137127

References
- European Food Safety Authority (EFSA). Dietary Reference Values. Available at:https://www.efsa.europa.eu/en/topics/topic/dietary-reference-values- Accessed on 28th July 2025.
- Kevin D. Cashman (2018) Vitamin D Requirements for the Future-Lessons Learned and Charting a Path Forward. Nutrients. Apr 25;10(5):533.
- EFSA (2010). Scientific Opinion on principles for deriving and applying Dietary Reference Values. EFSA Journal 8(3):1458. https://efsa.onlinelibrary.wiley.com/doi/abs/10.2903/j.efsa.2010.1458
- Mandy Claessens Laura Contor, Rosalie Dhonukshe-Rutten, Lisette C P G M De Groot, Susan J Fairweather-Tait, Mirjana Gurinovic, Berthold Koletzko, Ben Van Ommen, Monique M Raats, Pieter Van't Veer (2013). EURRECA-Principles and future for deriving micro
- Hilary J Powers (2021). Approaches to setting dietary reference values for micronutrients, and translation into recommendations. Proc Nutr Soc.Aug;80(3):365-372.
- EFSA NDA Panel (EFSA Panel on Dietetic Products, Nutrition and Allergies) 2016 . Scientific opinion on Dietary Reference Values for vitamin D. EFSA J. 14, 4547.
- Regulation (EU) No 1169/2011 of the European Parliament and of the Council of 25 October 2011 on the provision of food information to consumers: http://eur-lex.europa.eu/LexUriServ/LexUriServ.do?uri=OJ:L:2011:304:0018:0063:EN:PDF