EUFIC Forum n° 4: Observation, understanding and use of nutrition information on food labels
Last Updated : 10 February 2009Background
Nutrition labelling is regarded as a useful tool to help consumers make healthier choices. For this reason, nutrition information, normally found on the back of food packages, has begun to appear on the front of food packages. Various front-of-pack nutrition labelling schemes have emerged as governments, food manufacturers and retailers, and health and consumer organisations strive to find a label design that is the most effective.
The most frequently used voluntary front-of-pack formats in Europe include: Guideline Daily Amounts (GDAs) indicate the amount of energy and certain nutrients (e.g. fat, saturated fat, sugars, sodium or salt) in a portion (per bar, per slice) of a product, and what that represents as a percentage of the maximum amount of each nutrient that a healthy adult should consume in a day. These values are derived from international, EU and government dietary guidelines and recommendations.
Colour-coded systems (e.g. Traffic Lights) which show the amounts of fat, saturated fat, sugars and salt per 100g of the food or per portion (where the portion is over 100g). The label uses red, amber and green to indicate whether these amounts are high, medium and low respectively. The consumer can also see the amount (in grams) of the nutrients that are present in a portion of the food. The Traffic Light system is based on a recommendation from the UK’s Food Standards Agency (www.food.gov.uk/).
Colour-coded GDAs are a combination of the GDA labelling system and traffic lights or colour-coding. These labels show the percentage of the GDA of certain nutrients in a portion of food. Traffic Light GDAs also show whether the amount of these nutrients is high, medium or low in 100g of food (e.g. UK retailer ASDA which shows fat, saturated fat, sugar and salt). Colour coded GDAs provide information about whether the food has high, medium or low amounts of certain nutrients in one portion of food (e.g. French retailer Intermarché and the Nutri-pass system which uses amber, yellow and green to indicate levels of sugar, fat and salt).
Health logos, such as the Swedish Keyhole, are used on foods that meet certain nutrient criteria by category of food, and help consumers to identify and purchase better-for-you options. At present, nutrition labelling is not required in the European Union unless a health or nutrition claim is made (e.g. “Low fat”). But new legislation has been proposed that could make nutrition labelling mandatory, and may prescribe a specific format for front-of-pack nutrition labels.A number of research studies have tried to shed light on consumers’ reactions to such labels, but this research has a number of deficiencies. Many studies are based on respondents claiming to use these labels, but their actual use was not observed in stores. Other studies were based on consumers liking of particular types of nutrition labels and did not explore whether they were able to interpret and use the labels correctly (Grunert & Wills, 2007).
Little is known about how consumers use front-of-pack nutrition labels when they are actually grocery shopping and still less about how this information impacts product choice, whether this impact is sustained and whether people will have healthier diets overall as a result.
Download the complete PDF
Study Aims
This study focused on three main questions:
- How good is consumers’ nutrition knowledge?
- To what extent do consumers use nutrition labels when shopping?
- To what extent are consumers aware of guideline daily amounts (GDAs) and other labelling systems and are able to understand and use them?
What Was Tested?
The voluntary front-of-pack formats that are the used most frequently in Europe. These include:
- Guideline daily amounts (GDAs)
- Colour-coded GDAs
- Colour-coded systems (e.g. traffic lights)
- Health logos (e.g. Swedish keyhole)
The stores: Countries, retailers and nutrition labelling systems
|
Country |
Retailers |
Labelling systems |
|
UK |
Tesco Sainsbury’s ASDA |
GDA TL GDA/TL hybrid |
|
France |
Intermarché Auchan |
Colour coding and GDA (Nutripass, BOP) GDA |
|
Germany |
Lidl Real |
GDA, GDA (energy only FOP) |
|
Hungary |
Tesco, Interspar |
GDA |
|
Poland |
Tesco, Real |
GDA |
|
Sweden |
ICA, Coop, Axfood |
Health logo (Keyhole) + GDA |
The products: 6 product categories
- Salty snacks
- Soft drinks
- Breakfast cereals
- Ready meals
- Yoghurts
- Confectionery
How Was the Study Conducted?
The pan-European study was conducted with Professor Klaus Grunert of Aarhus University, Denmark. The study was carried out in stores in the UK, France, Germany, Poland, Sweden and Hungary from February 2008 to February 2009 on weekdays and weekends throughout the day. This study investigated consumer behaviour in the following ways:
1. Observation in the aisles (6 product categories)
- Whether shoppers looked at label and where
- Time spent choosing
- Number of products handled
2. In-store interviews
- Whether the respondent claims to have looked at nutrition information on the label
- Whether they remember any nutrition information from the label
- Which nutrition information the consumer is looking for
- Time pressure during shopping
- Major determinants of choice (nutrition, taste, convenience)
- Some nutrition knowledge questions
3. Take-home questionnaire
- Nutrition knowledge questions
- Knowledge about energy needs, energy expenditure and energy content of products
- Knowledge about what experts recommend should be consumed
- Awareness, knowledge and proficiency in using nutrition labelling system (e.g. GDA, Health logo, colour-coding, back of pack nutrition table)
- Background variables (to help explain some of the differences observed)
- Demographics
- Health
- Health motivation
- The role of food in the person’s life
A minimum of 1,800 in-store interviews were conducted in each country with over 11,600 in-store interviews carried out in total. 5,700 incentivised, take-home questionnaires were returned. A high percentage of females took part in the survey, reflecting that women are generally the main food shoppers (between 76% in UK and 61% in Germany). Respondents represented a good demographic spread across all age groups and social grades.
Key Results
Consumers in Europe have reasonably good knowledge about what they should be eating, but are uncertain about what they should be eating less of or avoiding. An in-home questionnaire measured respondents’ nutrition knowledge to gauge their understanding of nutrition information on food labels. Respondents were asked about health expert recommendations about foods and nutrients, whether a range of foods and drinks were high or low in certain nutrients and about their calorie contents. The questions were adapted slightly for cultural differences in food and drink consumption in each country. A nutrition knowledge index was derived from these questions. UK respondents demonstrated the highest level of nutrition knowledge.
A vast majority of consumers know that health experts recommend that you should eat lots of fruit and vegetables. Only a few consumers, however, correctly thought that experts recommend to eat a lot of starchy foods such as bread, rice, pasta and potatoes. Many consumers also mistakenly thought experts recommend they should “try to avoid” rather than “eat less” foods that are high in fat, sugar or salt. This reaction was strongest in the UK.
Consumers are also uncertain about different types of fat. While many respondents (over 60%) were aware that experts recommend that you should eat less fat, over 40% of respondents incorrectly thought they should eat less polyunsaturated fats. A number of consumers (over 35%) had a better understanding of recommendations that you should eat less or avoid saturates and trans fats and eat more omega-3 fats.
The Nutrition Knowledge Index
.jpg)
Consumers tend to underestimate the calorie needs and expenditure of an average adult and, worryingly, overestimate children’s calorie needs. A majority of respondents answered correctly that men and women have different calorie needs. In all six countries, women had slightly better knowledge than men about the calorie needs per day of the average active adult, but less than half of all respondents gave a correct answer in the store. When they answered incorrectly, respondents tended to under-estimate calorie requirements.
Very few consumers correctly estimated the amount of calories burned in one hour of watching television (at most 21%) or brisk walking (at most 28%). A majority of consumers underestimated the energy expenditure associated with these activities. Approximately one-third or more of respondents disconcertingly thought that children need more calories than adults. This misconception was highest in Poland (58%) and lowest in Sweden (32%). The younger age group and those of higher social grades, generally have higher nutrition knowledge.
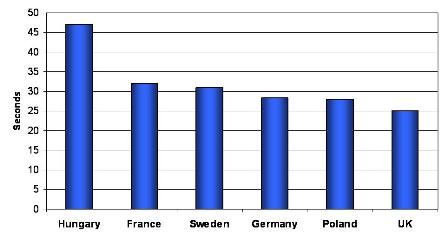
How much time do consumers spend to select products?
Observation of consumers at the 6 food category aisles in stores, showed that they spent on average 30 seconds per product bought. Most consumers deliberated the longest over ready meals, while the product that took the least amount of time to select varied between countries. Two-thirds of shoppers look at the front-of-pack in detail before making a purchasing decision, less than 15% looked elsewhere on the packaging.
Time spent handling products (seconds)
Is nutrition and health the main reason for product choice?
The nutritional and health aspects of food products were not high on respondents’ list of criteria for most products. While consumers in the UK considered the health and nutrition elements when buying breakfast cereals and yoghurts, they considered convenience first and foremost when purchasing ready meals. Taste was the main reason for choosing a particular product in Germany, Sweden, Hungary and Poland.
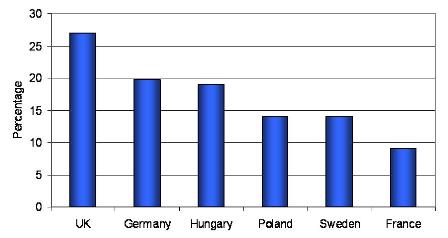
Do consumers look for nutrition information? If so, which nutrients do they look for?
Less than one-third of consumers said that they had looked for nutrition information on the packaging when asked after choosing a product. Of the consumers that reported looking for nutrition information, most consumers in all six countries said they had looked for calories, fat and sugar. Salt was a major concern only for consumers in the UK. Few consumers claimed to look for information about saturated fats and carbohydrates. Consumers were more likely to look for nutrition information when health and nutrition were their primary reasons for choosing a particular product. Having a high level of nutritional knowledge also meant consumers were more likely to look for nutrition information, except in Poland.
Did you look for any nutrition information on the packaging?
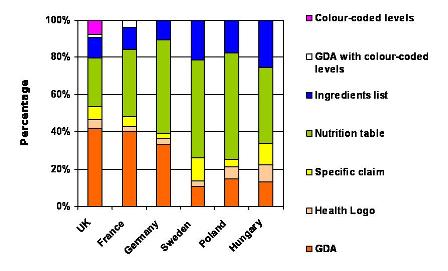
Where do consumers look for nutrition information?
Consumers look mostly at the Nutrition Table and GDAs for nutrition information. The Nutrition Table is the first place consumers said they look for nutrition information in Germany, Sweden, Hungary and Poland; GDAs and the ingredients list are second. In France and the UK, consumers said they look at GDAs first and the Nutrition Table second.
Where nutrition information is looked for
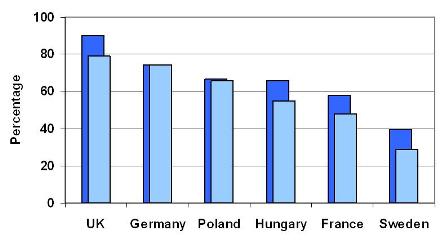
Are consumers aware of the various labelling systems?
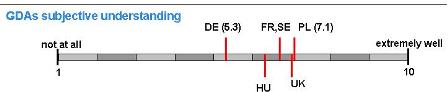
Awareness of GDAs (see graph below; light blue: heard of, dark blue = seen before) varies by country and is highest in the UK (90% have seen GDAs before) and lowest in Sweden (40%). Swedish consumers are more familiar with the Keyhole, which an overwhelming majority of Swedish consumers (over 95%) were able to recognise. In the UK, a large majority of shoppers were aware of both the traffic light system and GDAs (79%). The colour-coding system in France is less well-known as few shoppers had heard of (15%) or seen (23%) the Nutri-pass labels. When asked to rate their understanding of GDAs on a scale from one (not at all) to 10 (extremely well), respondents believed their understanding of GDAs is between average and fairly well (between 5.3 and 7.1).
Do consumers in Europe understand GDAs?
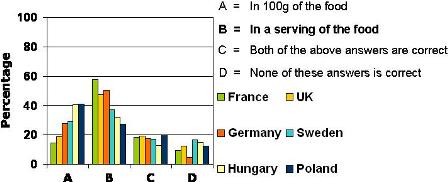
Consumers have a good understanding of GDAs, particularly in the UK and Germany. A majority of consumers, except in France, were able to correctly define GDAs when presented with multiple choice answers and understood that the figures refer to maximum daily intakes rather than targets. However, less than half of respondents in five countries understood that GDAs refer to a serving of food rather than 100 grams of food, with the exception of consumers in France.
Do UK and French consumers understand traffic lights and colour-coding?
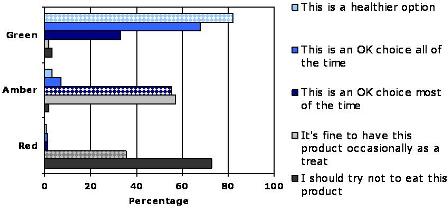
Colours indicating the highest nutrient levels (red in the UK, orange in France) are misinterpreted often by consumers in the UK and France. While a majority of UK respondents understood the meaning of the green traffic light, most respondents exaggerated the meaning of amber and red traffic lights. The red traffic light was taken to mean “I should try not to eat this product” by 73% of respondents rather than the UK Food Standard Agency’s definition, “It’s fine to have this product occasionally as a treat.” In France, majority of consumers (63%) had a similar reaction to the orange colour, believing it meant “should try not to eat this product.”
Which of the following statements do you think best describes what each colour means? (correct answers are indicated by the pattern)
Do Swedish consumers understand and use the Keyhole symbol?
A majority of consumers could correctly define the Keyhole symbol as a logo that identifies food and drinks containing less fat, less sugar and less salt and more fibre than products of the same type. There is also broad understanding (71%) that the symbol helps identify healthier foods of the same category or type, rather than across categories. Though awareness and understanding of the Keyhole is excellent, very few consumers said they had looked for the Keyhole on products in store. When asked to select the healthiest product between 3 ready meals, 59% selected the one product with the Keyhole.
What do UK consumers find helpful about traffic light GDAs?
UK consumers said the absolute amounts for one serving (53%) and the GDA (24%) are the most helpful elements on traffic light GDAs for indicating the healthiness of a product. Less than 15% of UK consumers stated that the interpretive elements (colour-coding or high, medium, low) were the most helpful for indicating the healthiness of a product.
Can consumers use nutrition labels to infer whether a product is healthy?
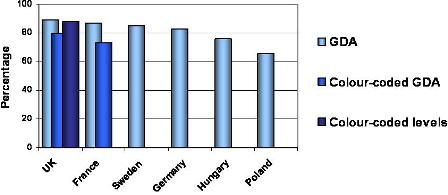
Respondents were shown sets of two GDA labels in isolation and were asked to identify which product was the healthier option. A majority of consumers (between 60 and 89%) in all six countries were able to use GDAs to select the healthier option between two products. Respondents in the UK were also provided with sets of two traffic light labels and traffic light GDA labels, while respondents in France were given sets of two colourcoded GDA labels. Over 80% of UK respondents were able to identify the healthier option regardless of the labelling system provided, while the difference between correct answers for GDAs and colour-coding in France was slightly greater but still above 70% for both systems.
Health inference - choosing the healthier option by comparison of 2 labels
When given a realistic choice between three ready-meals in food packages, consumers did not seem to be influenced by the labelling scheme used on the packaging. A large majority of consumers (over 70%) in the UK, France and Germany were able to identify the healthiest product regardless of the nutrition labelling system on the package (GDAs or traffic lights, or colour-coded GDAs in the UK and France). Fat and calorie levels were the main indicators used to infer healthiness.
Which consumers understand nutrition labels better than others?
Awareness, understanding and the ability to make correct health inferences from nutrition labels in all six countries are linked to nutritional knowledge and age, and to some extent to interest in healthy eating and social grade. There is also variation between countries. Respondents in the UK, France and Germany were especially adept at inferring the healthiness of food products.
Conclusions
The majority of consumers do not look for nutrition information 27% or less of consumers said they looked for nutrition information when selecting a particular product from the shelf. These consumers mostly wanted to find out about the calorie, fat and sugar content of the product and they mainly consulted the Nutrition Table or GDA label to get this information.
Consumers’ awareness, understanding and ability to make correct health inferences are linked to their nutritional knowledge, age, social grade and interest in healthy eating. The link between these factors was especially strong for nutritional knowledge. This suggests that improving consumers’ nutritional knowledge could help them interpret nutrition labels correctly.
When faced with colour-coded nutrition labels, most French and UK consumers exaggerate the meaning of the colour that represents a high amount of the nutrient. Consumers were not clear on the intended meaning of the colour-coded levels. A majority of consumers thought that colours indicating the highest nutrient levels (red in the UK, orange in France) meant they should ”try not to eat” this product.
Most consumers could use nutrition information on labels effectively to identify healthier products – if they chose to do so. While consumers have a reasonable knowledge of nutrition and most consumers can use nutrition labels when prompted, only a minority actually looks at this information when shopping. We still do not know how much influence these labels have on consumers’ purchase decisions. The long-term impact on people’s dietary choices is also unknown. Analysis of consumers’ purchasing behaviour in supermarkets over time is needed.
Acknowledgements
We are grateful to the retailers who allowed EUFIC to conduct this research in their stores, especially those that provided incentives for respondents.
Click here to access the publication.
References
- Agencies used for fieldwork: TNS (UK), Synovate (France), GfK (Germany), Pentor (Poland), Norstat (Sweden), Corvinus University/Focus Studio (Hungary)
- Grunert, K.G and Wills, J.M (2007). A review of European Research on consumer response to nutrition information on food labels. Journal of Public Health 15:385-399.