EUFIC Forum n°5: Consumer response to portion information on food and drink packaging
Last Updated : 01 February 2011Key Findings
- One third of respondents claimed to have looked regularly for portion information on food and drink labels, but it is still price and use by date that were most looked for by consumers (90% look often or always for it).
- A majority of consumers described a portion as the amount consumed by one person in one sitting. Across all countries respondents were more likely to agree that a portion is the amount a person should be eating or drinking rather than what they are likely to consume.
- Portion information was considered to be relevant to nearly half of respondents. The main reasons why portion information is considered to be relevant is that it helps them determine the amount to buy, eat or prepare, and it helps them monitor their food and nutritional intake. The reasons why portion information might not be equally relevant to everyone are because people are different or behave differently, not everyone is health or weight conscious, and not everyone takes notice of portion information.
- Consumers were unsure of who or what factors determine portion size. Food producers were most frequently mentioned as those responsible for setting portion sizes.
- For 15 out of the 19 food types studied, at least half of respondents in all six countries thought the stated portion size was ‘exactly right’. Where they differed, they were likely to think it was too small, rather than too big.
- Respondents were slightly more likely to agree than disagree to want portion information more widely available on food and drink packs. The preferred presentation format for portion information depended on the type of food. Per pack was the preferred format for most of the foods types tested. Per 100 g/ml was the preferred format for cheese, soft drinks, soup and condiments. And where the food type can be split into single units, nutrition information by unit was the most or second most preferred format.
- Most consumers were able to accurately read and relay nutrient information from labels. Providing nutrition information per portion in addition to per 100g information increased consumers’ ability to establish the nutrient content of a portion.
- The perception of portion size increased as pack size increased. However, for larger packs, the perceived number of portions was in-line with on-pack information stating the number of portions.
Background
In a climate of overweight and obesity, the amount consumers eat or drink is just as important as what is eaten. Nutrition information on food labels is regarded as a major means for encouraging consumers to make healthier choices when shopping for food. But it is not only what people eat that is important, it is how much of a given food they eat.
Current legislation requires nutrition information to be provided on pack per 100 grams or 100 millilitres. However, this quantity does not indicate the nutritional value of what is consumed in one sitting.
Very little is known about how consumers interpret and use portion information on food and drink labels. Exploring the role of information about portion size on food and drink labels is important because of its potential to enhance consumer use of nutrition information on labels and to act upon it. This research addresses these concerns on a pan-European scale.
Study Aims
To explore how consumers in Europe interpret and use portion information shown on food and drink labels, addressing the following aspects:
- Meaning and relevance of portion information
- What and who determines portion size
- If and how portion information on packaging helps consumers to use nutrition information
- If and how product size influences the perception of what constitutes a portion
How was the study conducted?
The study was designed with researcher Dr Monique Raats from the University of Surrey, UK.
The representative sample comprised 13,117 respondents from 6 European countries - Germany (2,171), UK (2,155), Spain (2,206), France (2,209), Poland (2,169) and Sweden (2,207). Averaged across the six countries, this makes 2,186 respondents per country. About half of the participants were men, and half women, aged between 18 – 65 years.
Respondents represented a good demographic spread across all age groups and education levels. As a result of using internet panels, the sample was slightly more educated and slightly younger than the population as a whole. The majority of the sample was comprised of working individuals who are in full time employment, live in multiple person households, and do most of the food and grocery shopping.
A pilot study was carried out in the UK in July 2010, followed by the main research from July to September 2010.
A web-based survey was used because this was regarded as being the most efficient and cost-effective way to collect such a large amount of data from so many respondents.
The questionnaire consisted of a range of questions on:
- Consumers’ concept of a portion, and their understanding of who establishes them and how
- Use of portion size information when using nutrition information
- Relating product size to perceptions of what constitutes a portion
- Demographics
- Current behaviour and attitudes such as:
- General Health Interest
- Objective and Subjective Nutrition Knowledge
- Numeracy
Segmentation of the sample
The sample was segmented according to interest in health (Roininen et al. 1999), subjective (Flynn and Goldsmith 1999) and objective (Grunert et al. 2010) nutrition knowledge and level of numeracy (Mackison et al. 2010).
It became apparent that Polish consumers were more likely to fall in the segment with low numeracy than those in the UK or France. Swedish consumers were more likely to be in the segment with higher levels of subjective nutrition knowledge than consumers in the other countries. Objective nutrition knowledge was higher in the UK and France, and lower in Poland.
Key Results
What information are consumers looking for on labels?
Respondents were asked to indicate how often over the last 6 months they had looked for different types of information found on food and drink packages (Fig. 1). Only one third said they always or often looked for portion information (highest in Poland – 45%, and lowest in Sweden – 23%). Price and use-by-date are still the most frequently sought information with almost 90% always or often looking for it. Cooking instructions, list of ingredients, nutrition information and storage instructions were also found to be sought more often than portion information when checking labels. There were country differences; UK consumers on average looked for nutrition information more often than respondents in other countries, whereas French consumers looked less.
Differences were found between segments of consumers based on interest in health. Those consumers who had a high interest in health were more often looking for portion information on labels than were those consumers with a low interest in health.
Figure 1: Information on food and drink packages ‘often’ or ‘always’ looked at in the last 6 months
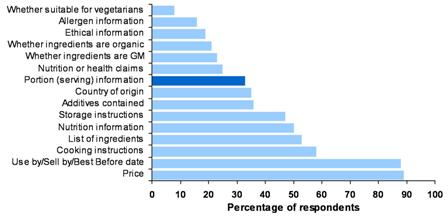
Thinking about the last 6 months, how often have you looked for the following information on food and drink packages? (Percentages shown for ‘always/often’ looking; Base size n=c.2,186 per country)
The meaning and relevance of portion information
Respondents were asked to describe what they thought a portion meant. In most cases, and particularly in France and Spain, people described portions to be the amount of food for one person, or a sensible amount. Some people did not refer to a person but talked about the amount of food as such, for example 25g or 100g of food, particularly in Germany.
Overall respondents were more likely to agree that a portion is what a person should consume, rather than what they were likely to consume (Fig. 2). The biggest difference in the level of agreement between the two questions was in the Swedish sample, where respondents were a lot more likely to agree that a portion is the amount a person should be eating/drinking rather than the amount they are likely to eat/drink. The reverse was true in Germany where the difference in level of agreement was small.
Figure 2: Meaning of portion information (two separate questions)
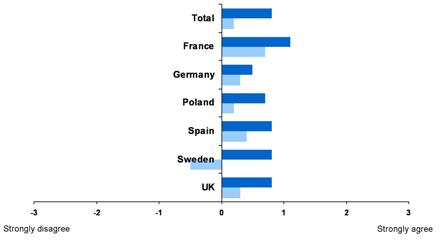
Q19: To what extent do you agree or disagree that portion (serving) information on food and drink packaging is the amount that a person is likely to eat or drink in one sitting? Q26a: To what extent do you agree or disagree that a portion (serving) is the amount that a person should eat or drink in one sitting. (Base size n=c.2,186 per country)
Overall just half of respondents considered portion information to be relevant to them but this ranged from as high as 70% in Spain down to 36% in Germany (Fig. 3).
The segment of consumers with a high interest in health more often stated that portion information was relevant to them than did those with a low interest in health.
When asked why portion information was relevant to respondents, most said it helped them determine the amount to buy, prepare or eat, and how long it would last, but also to monitor their food and nutrition intake.
When asked why portion information may not be equally relevant to everybody respondents often answered that ‘people are different’ or ‘people behave differently’. Interestingly, 1 in 5 across all countries reported that they did not know – 1 in 3 in the UK.
Figure 3: Relevance of portion information
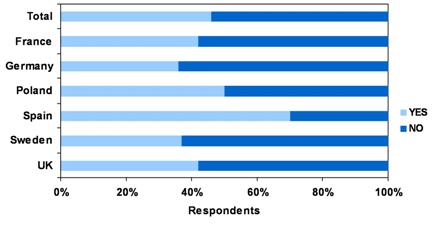
Is portion (serving) information on food and drink packaging relevant to you? (Base size n=c.2,186 per country)
What and who determines portion size?
Most consumers (23%) did not know how portion sizes are set. This was particularly the case in the UK where 44% did not know.
Where people were able to come up with an answer, the most frequently given answer was that portions are based on the number of calories in a product (16% across all countries).
When asked who they thought decided portion sizes most people (one third) thought it was the food producer. This was followed by health professionals, such as nutritionists and dietitians (France, Poland and Spain). Many respondents indicated they didn’t know, particularly in the UK (43%).
Portion information preferences
How should nutrition information be shown on food and drink packages?
The preferred format for portion information depended on the type of food (Table 1). ‘Per pack’ was the preferred format for most food types tested (12 of 19). ‘Per 100g or ml’ was the preferred format particularly for liquids, specifically soft drinks and soup. When a food could be split into single units such as biscuits, bread, slices of meat, there was a preference for having nutrition information by unit. Overall there was no food where ‘per portion in grams or ml’ was the preferred style of presenting nutrition information. There were also a number of foods where some consumers preferred to have the information provided per household measure, such as for condiments, breakfast cereal and soup.
Table 1: Format preferences for nutrition information by type of food/drink
|
Pack |
100g/ml |
Portion in g/ml |
Unit e.g. biscuit, slice, piece |
Household measure e.g. cup, spoon |
Part of pack |
|
|
Crisps |
43 |
19 |
17 |
|
|
|
|
Ready meals – frozen/chilled |
38 |
16 |
19 |
|
|
|
|
Pizza – frozen/chilled |
37 |
|
17 |
15 |
|
|
|
Yoghurt |
36 |
24 |
15 |
|
|
|
|
Chocolate bar |
36 |
|
|
27 |
|
|
|
Takeaway burger or sandwich |
35 |
|
18 |
26 |
|
|
|
Nuts |
33 |
22 |
22 |
|
|
|
|
Dried fruit |
33 |
21 |
21 |
|
|
|
|
Sugar confectionery (sweets) |
32 |
16 |
15 |
23 |
|
|
|
Scoop-able ice cream |
27 |
27 |
18 |
|
15 |
|
|
Spreads e.g. margarine |
26 |
26 |
21 |
|
15 |
|
|
Breakfast cereals |
25 |
22 |
20 |
|
21 |
|
|
Soup |
28 |
30 |
|
|
20 |
|
|
Soft drinks |
24 |
46 |
|
|
|
|
|
Condiments |
23 |
28 |
18 |
|
23 |
|
|
Cheese |
23 |
25 |
22 |
20 |
|
|
|
Biscuits |
24 |
|
|
49 |
|
|
|
Bread (sliced) |
22 |
|
|
48 |
|
|
|
Cooked, sliced meat |
22 |
23 |
18 |
26 |
|
|
For each of the types of products shown, please indicate how you would prefer nutrition information to be presented. (Only responses ≥15% shown; Base size n=c.2,186 per country)
There were some differences between countries. Notably, the French were generally more likely to want information per portion by weight/volume, other differences were product specific; for example, for cheese, UK respondents would prefer information per pack whereas Polish respondents would prefer per unit.
Is it important to have portion information on food and drink packages?
Consumers were also asked how important it was to have portion information on packs for the different food categories (Fig. 4). Overall there was little difference between food categories but people found it to be more important on ready meals, pizza products, and less so on nuts and dried fruit.
Figure 4: Importance of portion information being included on product packs
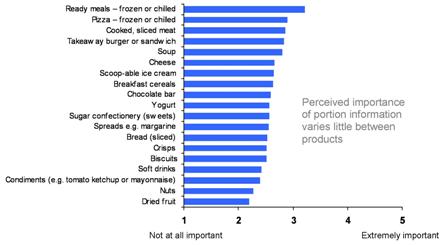
How important is it to you that the pack tells you what one portion (serving) is? (Base size n=c.2,186 per country)
Are portions the right size?
Overall half the consumers stated that the portion sizes they came across on the food and drinks packages tested, were exactly the right size (Fig. 5). For three quarters of the food types shown (15 of 19), at least half of respondents in all six countries studied thought the stated portion size was ‘exactly right’. Where there were some disagreements people tended to think the portions were too small rather than too big, and this was particularly the case for ready meals, soup, breakfast cereals and pizza.
Figure 5: Perception of portion sizes
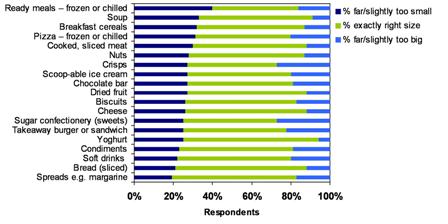
In general do you think that portion (serving) sizes which are recommended on the following food and drink packaging are….. (Base size n=c.2,186 per country)
Do people want more portion information?
Respondents were slightly more likely to agree than disagree that they would like portion information to be more widely available on food and drink packaging. There were some differences across countries with Spain being more interested in seeing more information.
How does portion information on packaging help consumers use nutrition information?
Consumers were shown different back of pack nutrition tables and asked to answer questions based on the information provided on the label with an increasing degree of difficulty. This tested the extent to which they were able to read nutrition information on labels and to carry out simple as well as more complex calculations. These were designed to reflect real life situations.
When consumers were asked how much of a nutrient (e.g. saturated fat or fibre) they would find in 100g of a given product and the information was provided on the label, most consumers (79%) were able to accurately read and relay nutrient information from labels.
In another task, consumers had to determine the specific nutrient content in a portion using nutrition information displayed only per 100g (how much fibre or saturated fat are in a portion of the product). The percentage of correct answers and time taken to provide it depended on the complexity of the calculation. Correct answers were given by 61% for the amount of fibre in a 50g portion (fibre in 100g divided by 2), but only by 15% for the amount of saturated fat in a 30g portion (saturated fat in 100g multiplied by 0.3), and it took respondents 27 and 47 seconds to calculate, respectively.
When portion information was present on the label along with per 100g/ml information, there were more correct answers (87% vs 61% for fibre, 86% vs 15% for saturated fat) and the response time was quicker (24 vs 27 seconds for fibre, 21 vs 47 seconds for
saturated fat).
How does pack size influence perception of what constitutes a portion?
Consumers were provided with photos containing different numbers of a given product (chicken nuggets (4 vs 9), sweets (10 vs 60), biscuits (2 vs 15)) and asked how many (units) would make up one portion. The bigger the pack, the more units consumers think are in a portion. For example, consumers shown 10 sweets thought a portion was 5 sweets, those shown a pack containing 60 sweets thought 10 sweets made up a portion. Interestingly, Poland in all cases when shown the larger number of products thought there were more units to a portion than did the other countries.
Similar results were found when consumers were shown pictures of different pack sizes of the same product for four groups – crisps, confectionery, lasagne and soft drinks – and asked to indicate how many portions were in the packs shown.
For the lasagne ready meal, most consumers thought the 400g pack constituted one portion, the 1000g pack was two portions, and the 1600g pack was 4 portions.
Most consumers thought that a 34.5g bag of crisps was one portion. However, when shown a 120g bag of crisps there was a wider range, with the majority stating two portions, but the mean answer being 4.
When shown different packs of chocolate confectionery bars, most respondents thought the smallest bar (18g) was one portion or less, and a majority (59%) believed the 45g bar to be one portion. The pack containing two bars (2 x 35g) was considered as two portions by a majority of consumers in the study (44%).
When consumers were shown different-sized soft drinks (bottles and cans of 150/250/330ml and bottles of 500/1000/1500ml) the majority considered all three of the smaller (≤330ml) soft drink packs to be one serving When asked about the 500ml most consumers thought it was two portions, but for bottle sizes 1000 and 1500ml there was less agreement as to how many portions these contained.
Once again, the average perception of portion size of the drink increased with the size of the bottle, but interestingly for the biggest bottle (1500ml) the mean portion size (212ml) is still below the recommended portion size of 250ml.
Conclusions
This study is the most comprehensive study on consumers and portion information in Europe. It provides evidence that when nutrition information per portion is present on pack in addition to per 100g/ml information, it helps consumers to use nutrition information correctly and quickly.
Consumers view portions as the amount they should be eating rather than what they are likely to eat in one sitting. Generally, people thought current recommendations of portion sizes on pack are correct but sometimes too small. Uncertainty remained as to who determines portion sizes, and on what grounds. Many consumers question the relevance of portion size to them and are not looking for it on the label.
Consumers’ perception of what constitutes a portion is influenced by pack size. The bigger the pack, the larger the consumer perception of portion size. If and how this impacts on actual consumption remains to be demonstrated.
Whilst there is an opportunity to educate consumers on what constitutes a portion and how they are set, the challenge remains to encourage consumers to look for and use the information in the first place.
Click here to access the publication.
References
- Agency used for fieldwork: MMR Research Worldwide
- Flynn LR, Goldsmith RE (1999). A short, reliable measure of subjective knowledge. Journal of Business Research 46(1):57-66.
- Grunert KG, Fernández-Celemín L, Wills JM, Storcksdieck genannt Bonsmann S, Nureeva L (2010). Use and understanding of nutrition information on food labels in six European countries. Journal of Public Health 18(3):261-277.
- Mackison D, Wrieden WL, Anderson AS (2010). Validity and reliability testing of a short questionnaire developed to assess consumers’ use, understanding and perception of food labels. European Journal of Clinical Nutrition 64:210-217.
- Roininen K, Lähteenmäki L, Tuorila H (1999). Quantification of consumer attitudes to health and hedonistic characteristics of foods. Appetite 33:71-88.
Quote as:
EUFIC (2011). Consumer response to portion information on food and drink packaging - A pan-European study. EUFIC Forum n° 5.