Food waste in Europe: statistics and facts about the problem
Last Updated : 30 August 2024
Would you go into a supermarket, buy five shopping bags of food, and then immediately throw one away? Statistically, that’s what’s happening to our food today. Nearly one fifth of all the food that is available to us is wasted. When we waste food, we waste all the resources that go into producing and transporting the food, such as land, water and fuel use, without gaining any of the benefits of feeding people. When food ends up in landfill it also contributes to greenhouse gas emissions. Food waste remains a problem in Europe and around the world.
What is the difference between food waste and food loss?
In order to tackle food waste, understanding the problem is key to finding good solutions. A first step is to measure the amount of food that goes to waste and to understand where along the supply chain the waste is happening. Depending on where it happens along the supply chain, we use the terms food loss or food waste.
- Food loss refers to any food that is discarded, incinerated or otherwise disposed of along the food supply chain from harvest/slaughter/catch up to, but excluding, the retail level, and is not used for any other productive use, such as animal feed or seed.1
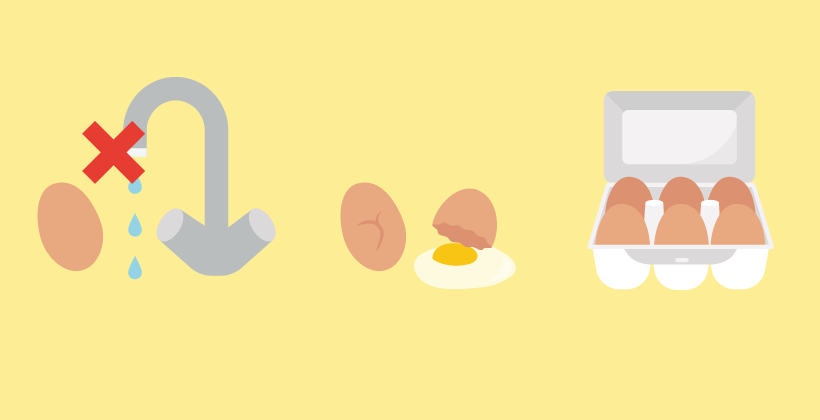
- Food waste refers to food that is discarded at the level of retailers, food service providers and consumers. Food is wasted in many ways, for example
- Fresh produce that deviates from what is considered optimal (e.g. size, shape or colour) and is removed during sorting actions
- Foods that are discarded by retailers or consumers when it’s close to or beyond the best before date.
- Unused or leftover food that is thrown out from households or restaurants.1
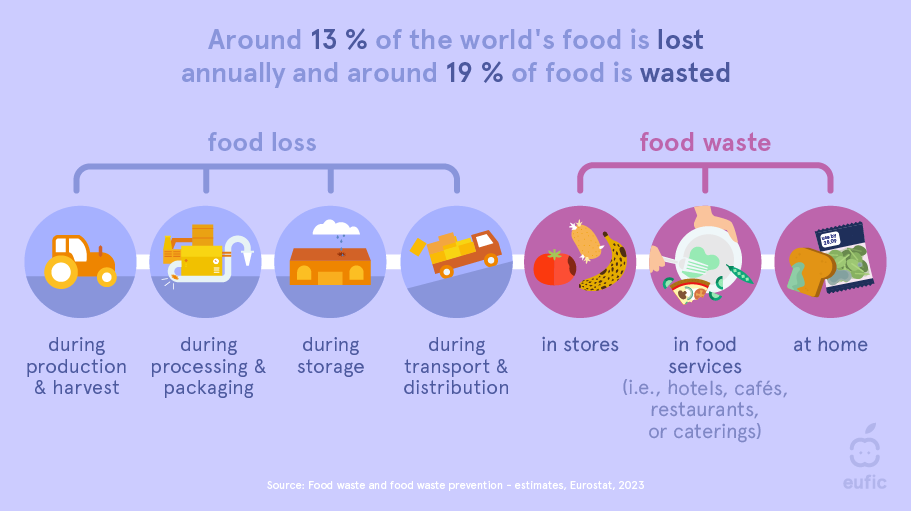
Fig. 1 – What’s the difference between food loss and food waste?
Statistics and facts about food waste and loss
The UN Sustainable Development Goal 12.3 aims to halve food waste at the retail and consumer level and to reduce food loss across supply chains. Measuring food loss and waste on a national, regional and global scale is not easy, but the European Commission has adopted a common EU methodology in order to measure food waste at each stage of the food supply chain.2 In 2020, Member States first collected data using this common methodology. Below, we list some of key statistics and facts about food waste and loss based on current estimates.
Global estimates
- 19% of the food available to consumers is wasted globally, at the retail, food service, and household level. In addition, 13% of food is lost in the supply chain, from post-harvest up to retail.3 Food waste alone generates up to 10% of global greenhouse gas emissions – almost five times the total emissions compared to the aviation sector.3
- Latest estimates (2022) suggest that around 1.05 billion tonnes of food waste were generated globally, out of which:
- 60% came from households (631 million tonnes)
- 28% from food service (290 million tonnes))
- 12% from retail (131 million tonnes).3
- On average, each person wasted 79 kg of food per year. This is equal to 1.3 meals every day for everyone in the world impacted by hunger.3
- Levels of food waste are similar in high, upper-middle and lower-middle income countries. Observed average levels of household food waste differ by just 7 kg/capita/year.3
EU estimates
- In 2021, more than 58 million tonnes of food waste were generated in the EU.4 This is equal to
- 131 kg per person or
- 132 billion euros or
- 252 000 000 tonnes of CO2.4
- Around 10% of food made available to EU consumers (at retail, food services and households) may be wasted. At the same time, more than 37 million people cannot afford a quality meal (including meat, fish, chicken or vegetarian equivalent) every second day.4
- Households waste the most amount of food across all economic sectors (more than 31 million tonnes) – almost twice the amount compared to the sectors of primary production and manufacture of food products and beverages.5
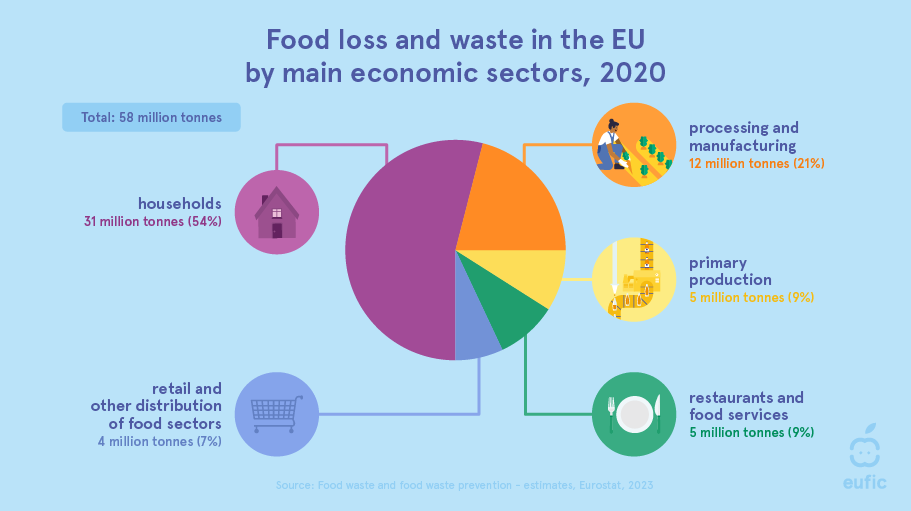
Fig. 2 – Food waste in the EU by main economic sectors, 2020.5
- Most food is wasted at the consumption stage (62%). This is responsible for more than 70% of the environmental impacts of food waste generation. That’s why preventing food waste in our own households and at the food services level is so important.5
- Cyprus, Belgium, and Denmark make the top-3 of countries with the highest amount of total food waste per inhabitant. Slovenian, Croatian, and Swedish inhabitants produced the least amount of food waste across all Member States.5
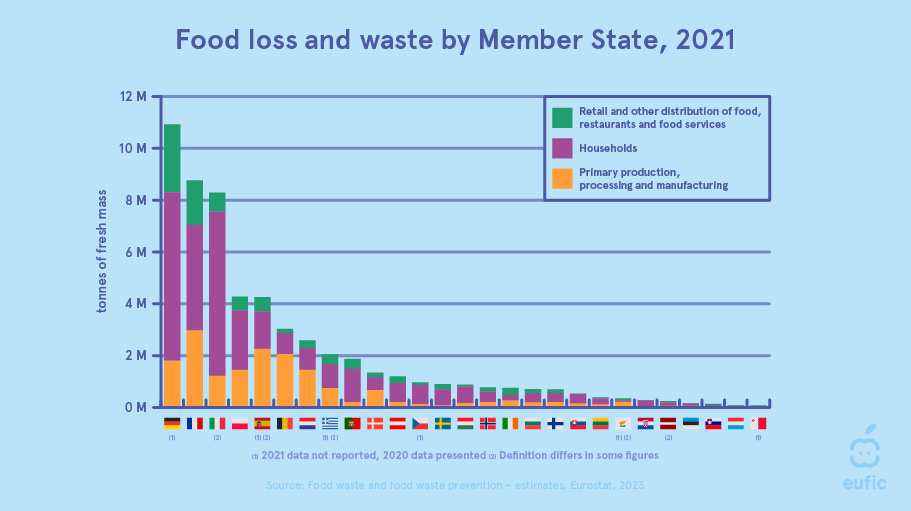
Fig 3. – Food waste by Member State, 2021.5
- If food waste were a Member State, it would be the EU’s 5th largest emitter of greenhouse gas emissions.6
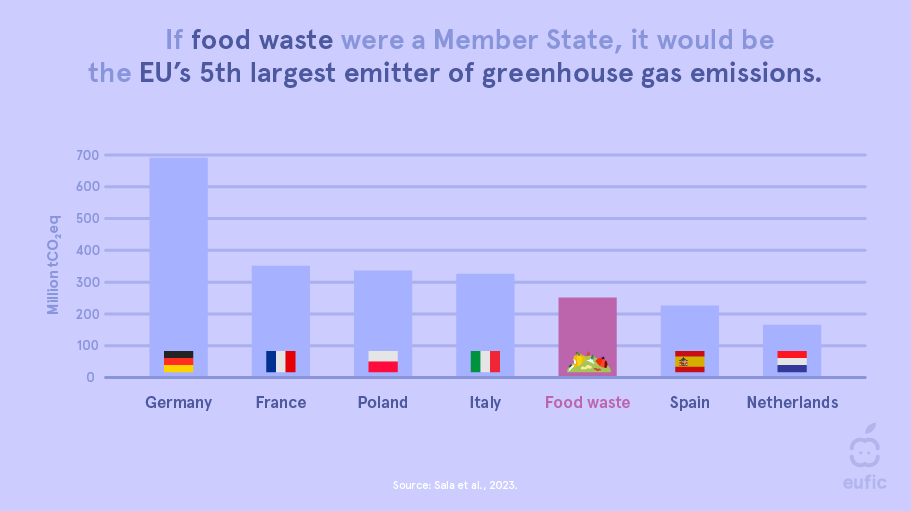
Fig. 4 – Comparison between the climate impact of food waste with the climate impact of the six largest emitters in the EU.6
- The further along the supply chain the food loss occurs, the more carbon intensive the loss and waste. That’s because more resources have gone into producing for example tomato sauce (processing, transport, retail and packaging, in addition to land and water use and farming) that we can buy in the supermarket than has gone into a tomato picked directly from the field. If we waste tomato sauce, we waste the additional resources that have accumulated along the supply chain.7
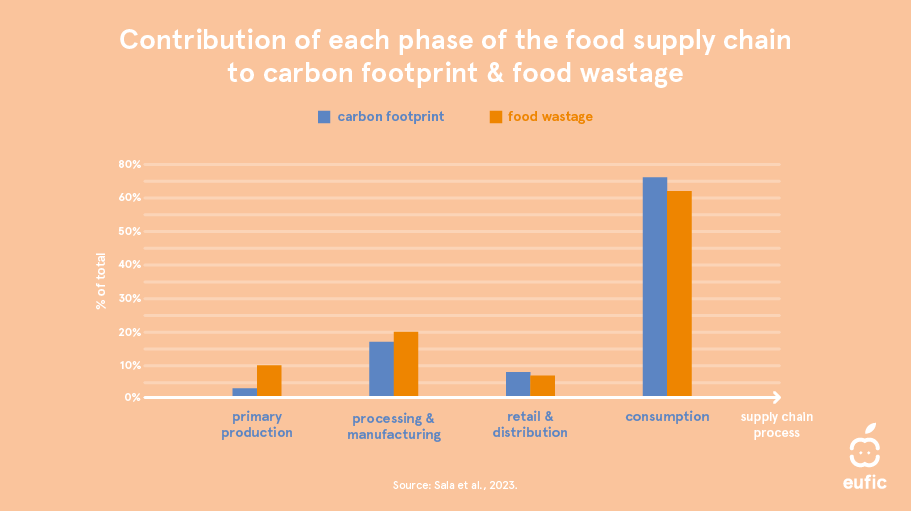
Fig. 5 – Contribution of each phase of the food supply chain to carbon footprint and food wastage.6
- The most wasted product groups (in terms of mass) in the EU were fruit (27%), vegetables (20%), and cereals (13%).6
- Different foods have different environmental impacts. For example, the volume of meat and dairy that is wasted and lost is not very high compared to foods such as cereals and vegetables. However, meat and dairy require much more resources to produce, so wasting meat and dairy still has a significant impact on climate change. It is estimated that meat and dairy contribute to less than 20% of food waste generated in mass, but for more than 50% of the environmental impacts of food waste in the EU.6
- Food waste accounts for about 16% of the environmental impacts of the EU food system. Preventing food waste is therefore a powerful climate change mitigation strategy.6
- By environmental impact category, food waste is responsible for
- 16% of the CO2 emissions of the EU food system
- 12% of the water use of the EU food system
- 16% of the land use of the EU food system
- 15% of marine eutrophication of the EU food system
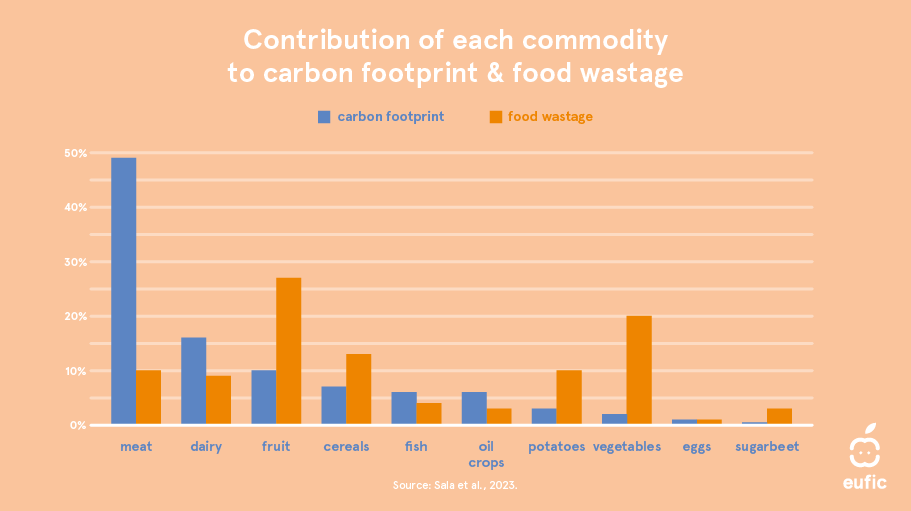
Fig. 6 – Contribution of each commodity to carbon footprint and food wastage.
- However, the EU is making progress on reducing food waste.
- In 2004, 117.5 million tonnes of food was wasted (240 kg per person).8
- In 2006, 116.2 million tonnes of food was wasted (235 kg per person).8
- In 2008, 96.9 million tonnes of food was wasted (195 kg per person).8
- In 2010, 92.2 million tonnes of food was wasted (184 kg per person).8
- In 2012, 88 million tonnes of food was wasted (173 kg per person).9
- In 2020, 58.1 million tonnes of food was wated (130 kg per person).5
- In 2021, 58.4 million tonnes of food was wated (131 kg per person).5
- A better understanding of date labelling on food, such as ‘use by’ and ‘best before,’ could potentially help reduce EU food waste by up to 10%.10 In a study on date marking on food labels
- 40% of respondents correctly interpreted the use by label: the food will be safe to eat up this date, but should not be eaten past this date.
- 47% of respondents correctly interpreted the best before label: the food can be eaten after this date but it may no longer be at its best quality.
Why should we all reduce our food waste?
Tackling food waste is a triple win: it saves food for human consumption; it lowers the environmental impact of food production and consumption; and it helps businesses and consumers to save money. Did you know that a 4-person household would save on average about €400 euros per year if they reduced their food waste by half?11
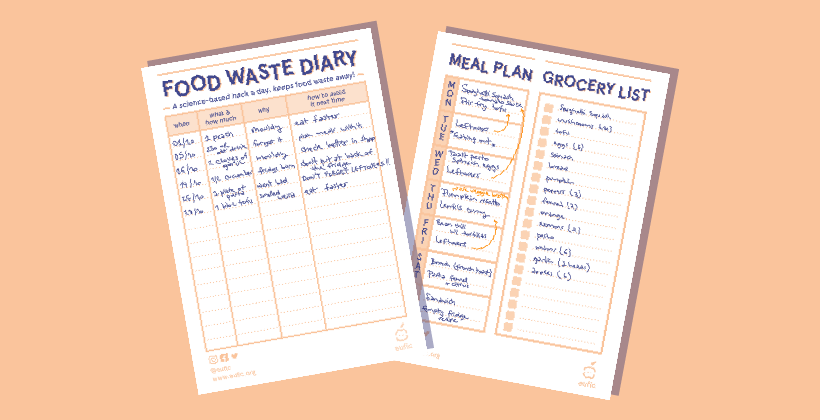
We, as consumers, can have a direct impact on the food waste problem by paying attention to our own behaviour. If you want to reduce your food waste at home, take our food waste quiz to evaluate your food waste practices and identify effective strategies tailored to your lifestyle that can minimise food waste. Read more about food waste and get some tips here.
References
- FAO. Food loss and food waste.
- Commission delegated decision (EU) 2019/1597, 3 May 2019 supplementing Directive 2008/98/EC of the European Parliament and of the Council as regards a common methodology and minimum quality requirements for the uniform measuremenst of levels of food waste
- United Nations Environment Programme, Food Waste Index Report 2024. Think Eat Save: Tracking Progress to Halve Global Food Waste.
- European Commission. Commission Staff Working Document Impact Assessment Report Accompanying the document Directive of the European Parliament and of the Council amending Directive 2008/98/EC on waste (2023)
- Eurostat. (2023). Food waste and food waste prevention – estimates. Accessed 19 August 2024.
- Sanyé Mengual E, Sala S. Consumption Footprint and Domestic Footprint: Assessing the environmental impacts of EU consumption and production. Life cycle assessment to support the European Green Deal, Publications Office of the European Union, Luxembourg,
- FAO (2015) Food wastage footprint and climate change.
- EPRS. (2014). Tackling food waste. The EU’s contribution to a global issue. Accessed 19 August 2024.
- Stenmarck, Â., Jensen, C., Quested, T., Moates, G., Buksti, M., Cseh, B., ... & Östergren, K. (2016). Estimates of European food waste levels. IVL Swedish Environmental Research Institute.
- European Commission, Directorate-General for Health and Food Safety, Market study on date marking and other information provided on food labels and food waste prevention – Final report, Publications Office, 2018
- European Commission. (2024). Frequently Asked Questions: Reducing Food Waste in the EU. Accessed 19 August 2024.