How to read graphs
Last Updated : 06 September 2023
Table of contents
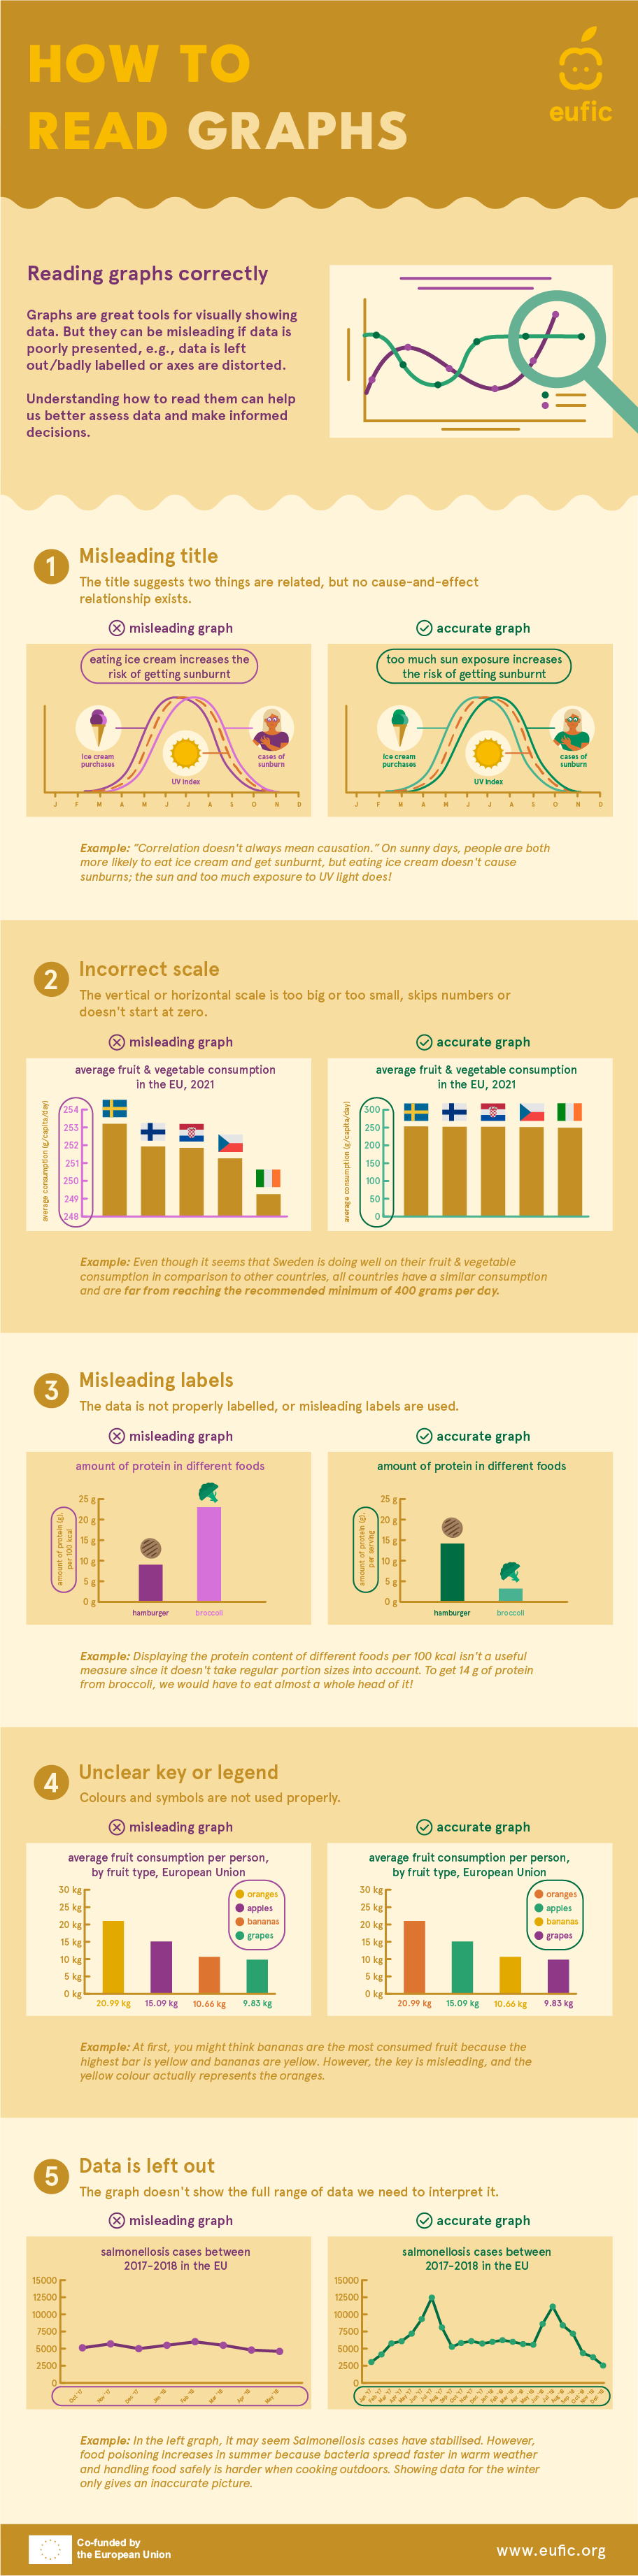
In an era where information is readily available, graphs have become essential tools for conveying data in a visually appealing and concise manner. Understanding how to read them accurately is crucial for making informed decisions. However, graphs can be misleading if not interpreted correctly or are even made misleading on purpose at times. This infographic shows common cases of misleading graphs, including leaving out data, not labelling data properly or skipping numbers on the vertical axis. Here are some handy tips to help you identify misleading graphs.